
If you are a company with a retail POS data, without any analytical platform, this will act as a spring board to get insights of your business. Once you understand the insights, you get insights which will help you to optimize your operations.
Steps to get insights: Extract the item_master and sales data from your POS system in the following format. Your service provider / IT team can give two files when they know what data you need.
Upload two data sets from your POS system to see the dashboards and predict next year sales.
| Item_Code | Item_Name | Item_Category | Item_Sub_Category |
|---|---|---|---|
| 56455 | Pizza |
Food |
Fast Food |
| 65445 | Bread |
Food |
Staple Food |
| Sales_Id | Sales_Date | Item_Code | Item_Name | Sales_Quantity | Unitcost_Price | Unitsale_price | Total_sales |
|---|---|---|---|---|---|---|---|
| 16121546 | 1/06/2019 12:25 |
43654 |
Ice Coffee |
1 |
1.1 |
1.34 |
1.34 |
| 16121546 | 21/02/2019 15:25 |
43546 |
Pastry |
2 |
1.8 |
2.45 |
2.45 |
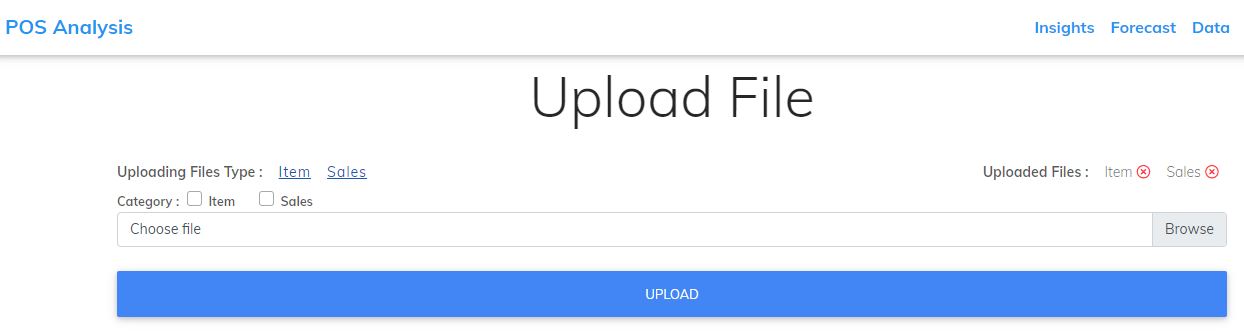
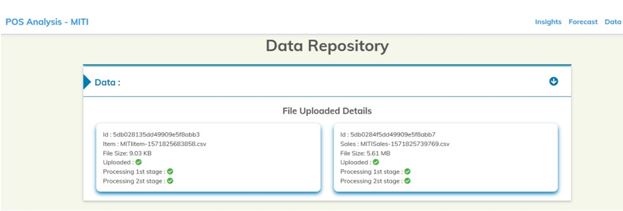
You can check the Data Repository option to know the status of the files you uploaded.
You will get the following Visuals to know your trends and patterns. You are ready to know the trends and patterns of your business.
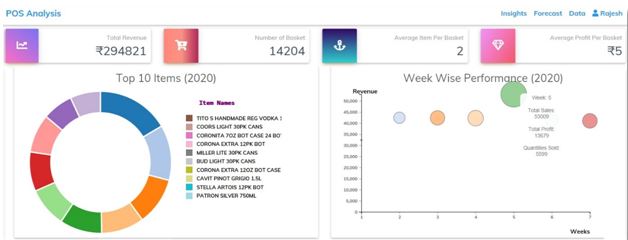
As part of 360 View, you will see Revenue related KPI’s and Basket related KPI’s. You will get to know the Monthly Sales trend, comparative monthly analysis, weekly sales trend and top 10 items which are contributing to your sale.
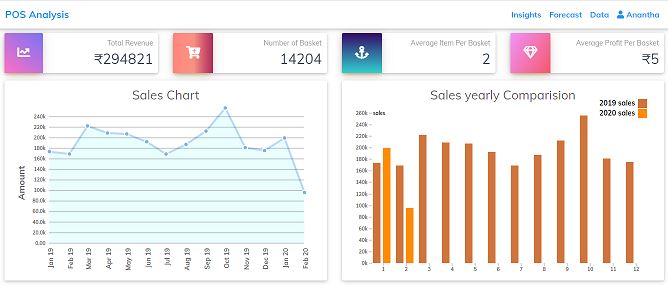
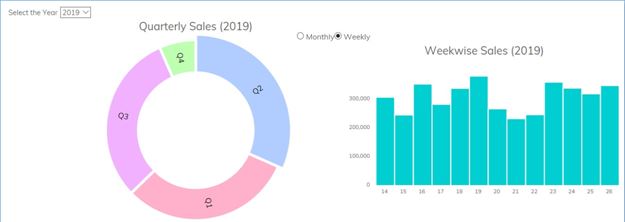
You will see the trends of your sales in the year you are interested. In the following visual you can see sales trend in Q2 of 2019.
If you have face any issues or if you need more information regarding this platform, please send us an email hello@typetheta.co.uk