As an ETL developer, its important to see what are the various touch points in the ETL world. You may be working in any one of the touch point in the ETL stream line. In a DW.
Finding Story / 360 in Data sets
A story has five important elements based on many story telling experts. In our data visualization / analytical projects we can link those elements to our real world of business events.
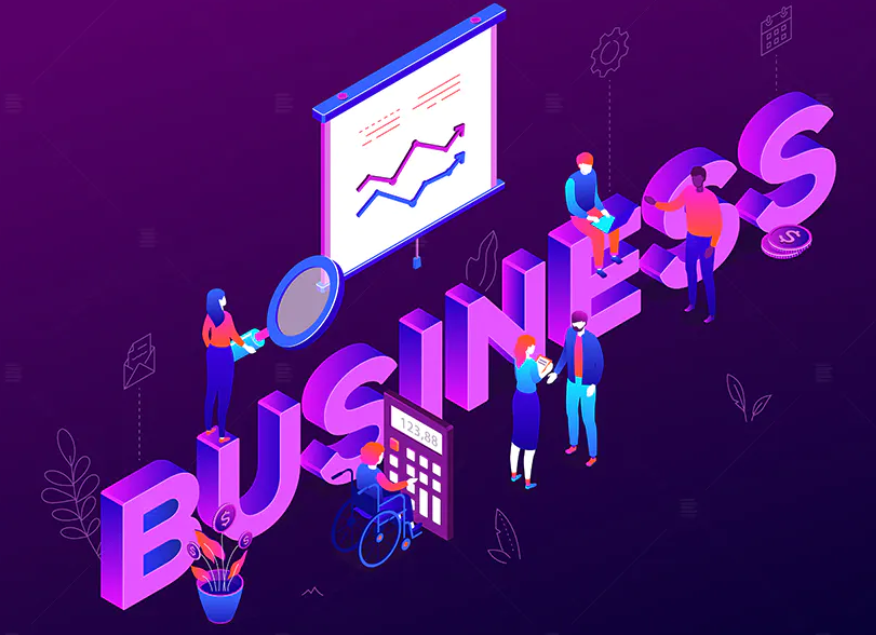
Importance of Analytics Platform for Small Business
The following analysis from a survey will give you an idea of how Analytics platform/services will help the organizations in the world. Big companies invest more and reap benefits both in terms insights.
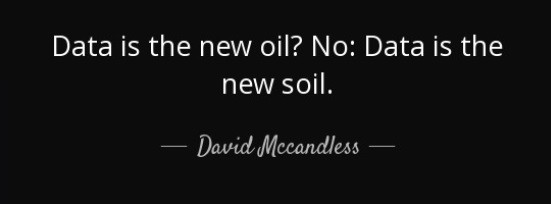
Any person who relies on data to take any decision or a person who understands the origination of data or how business uses the data to enrich value tota can be called as Data Citizens.
Conversational BI
BI evolved to answer management questions on an adhoc basis. A report which we create on the fly allowed MIS team to provide valid / required data for decision makers. We used interactive reports and Dashboards to get the job done by using Drill.
Modernization of Analytical / Reporting Platform
What you can do with data / information? According to research if you take the decision based on the data and your business knowledge (combo) then you perform 2x times better than the gut feel decision.
Data Analyst / Database Developer -- Secrets To Shine
When you join a company or a project, understand the mission and vision of the company and for what purpose they are building this application or how this application.
When you offer Visualization Analysis?
If you come across any customer who have the following pain points, your value on the visualization will give a better ROI.
Principles of Dashboard Design
Every thing we do in the world have some part of design principles. Many companies produce the similar products with a touch of difference in the way its designed.
Culture in an Enterprise
The culture with in the company plays a very important role to make an employee feel good about the work he / she is doing.
Lets see what is the meaning of Science. Its a study of the structure and behavior of the physical and natural world through observation and experiment.
When companies sell Visual Analysis tools, they use standard excel or csv data (in many cases) to show case the ability of the tool.
Ways of calculating ROI from BIDW implementations
Most of us read that, about 75% of implementations don't give the ROI in BIDW related projects. When I first started to work in BIDW projects, team is not able to prove the ROI.
Insight, Visualization and Analytics
I come across people who use Insight, Visualization and Analytics; to mean the same thing. Are they all really one and the same?
Can Business Executives develop Dashboards?
Most of the Dashboard software companies tell the businesses that Business executives can develop their own Dashboards or they can un earth the patterns in the data with out any IT help.